Our features
Thanks to its wide range of features, EasyPicky is much more than just a video recognition solution. In a matter of seconds, it collects all the relevant data and provides an in-depth analysis of KPIs such as digital distribution, share of shelf, stock-outs, as well as merchandising KPIs and competitor analysis.
Store survey & Merchandising

Numeric Distribution
Our tool helps you to easily view, count and control the number of facings of your products on the shelf in an instant.

Share of Shelf
This performance indicator is used to assess the share of shelf space allocated to a reference or brand within a department or product family.

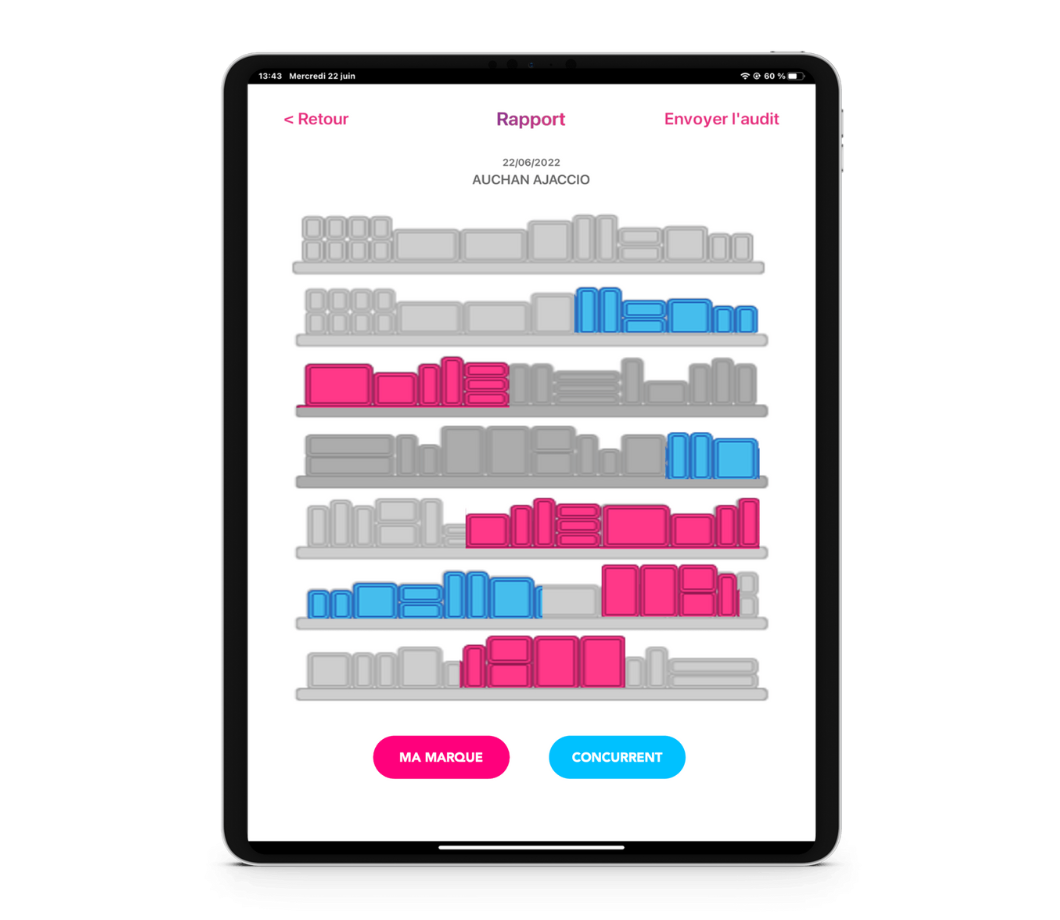
Brand Blocks
This function allows you to identify and measure the overall strength of a brand’s products to improve its in-store visibility and strengthen its positioning.

Hot VS Cold zone
The positioning of your products can be optimised by identifying whether they are in high or low traffic areas. This data is useful when negotiating with department managers.
Competitor monitoring
EasyPicky makes it possible to identify your competitors’ products on the shelf. Our AI can recognise products competing with yours, enabling you to analyse the visibility and all the KPIs of your competitors in shop.
Our technology recognises and collects all your competitors’ visible data.
This will give you a reliable, complete and objective picture of your competitor’s overall situation in-store.
The EasyPicky app produces a complete report of your competitors’ KPIs comparable to the report on your own products in an instant: ND, SoS, Brand Blocks, Hot Zone, etc.
This gives you a comparative view of your KPIs and those of your competitors.

Planogram compliance
Our Artificial Intelligence solution enables you to analyse the conformity of your merchandising strategy with the actual layout of your products in the store, as well as with the standards and regulations of your sector. EasyPicky compares the reference planogram with the actual configuration observed in shop, highlights any differences and gives you a visual indication of the areas where corrective action is required. This means your teams can easily re-implement your products to optimise the way they are promoted, in line with your strategy.
Detecting differences on the shelf
Product layout optimization
Compliance with standards and regulations


Realogram
Our solution is capable of producing a digital representation of the shelf to compare the compliance rate of your shelf layout with the theoretical planogram in real time. By examining the differences, your sales forces can strategically reposition your products on the shelf to improve their visibility.
It is also possible to cross-reference realogram data with checkout data, enabling you to anticipate corrective actions to improve your sales.

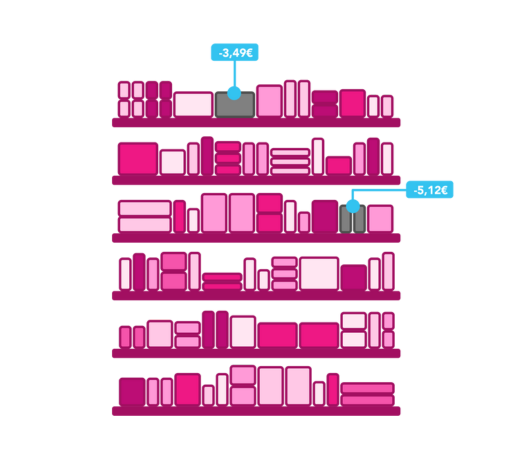
Loss of profit
This function allows you to draw up a list of out-of-stock products, i.e. products that are missing from the shop’s theoretical assortment, together with their corresponding selling prices. This gives you an immediate overview of potential revenue losses and the corrective action to be taken.
Sales plan
Having an operational sales plan is essential for placing orders easily and optimising your time in shop. To do this, you need to have in-depth knowledge of the current state of your shelves and product data. This is where our solution comes into play: from the store survey to ordering your products.
EasyPicky identifies the products missing from the shelves and draws up a complete list of products on which an action plan should be prioritised.
Thanks to this tool, you can make informed decisions and manage your stock shortages more effectively.
In practical terms, once you’ve filmed your aisle, you can click on “generate a sales plan” and each missing product comes up with a photo, a name and a barcode for quick and easy identification, which can be scanned directly by the department manager.
Our solution enables you to prepare for your negotiations with the store manager instantly.


Web Interface
EasyPicky is the ideal tool for national sales directors and sales force managers. Using our web interface, you can access all the field data you need to optimise your decision-making and provide your teams with the best possible guidance. Our web interface is designed to give you a 360° view of your teams, by user, by point of sale, by scope and by product. You’re in the driving seat, choosing your filters to get the vision you want!
With our web interface, you won’t have to wait for monthly or weekly reports to assess the performance of your teams and points of sale. Our platform provides you with real-time data, enabling you to react quickly to feedback from the field and any changes you observe.
At EasyPicky, we understand the importance of KPIs in the business decision-making process. That’s why our web interface offers an effective way of centralising, harmonising and analysing the data captured at all your points of sale.
Boost your retail strategies
EasyPicky enables you to gather a goldmine of information to optimise your marketing and sales strategies.
Thanks to its various features, EasyPicky standardises field surveys, guaranteeing reliable, usable data. Our solution gives you access to crucial KPIs, improving the productivity and performance of your teams in the field. You’ll be able to make informed decisions, effectively manage stock-outs and implement targeted recommendations to improve your retail execution: a real driver of growth for your sales.


