The Complete Guide to Retail Data Analytics: Definition, Types & How It Works

Retail data analytics is the process of collecting, analyzing, and interpreting in-store field data, including shelf presence, stock levels, and planogram compliance, to generate actionable KPIs that help CPG brands and retailers make faster, smarter merchandising and sales decisions.
Why Retail Data Analytics Matters for CPG and FMCG Brands Today
This is not juste a trend. Most CPG and FMCG brands build their business and merchandising strategies and insights at headquarters and send it to the field. What happens next is largely invisible. Products are misplaced, facings are reduced, out-of-stocks go undetected for days. By the time the data reaches a decision-maker, the sales opportunity is already lost. It closes that gap. It gives brands a real-time, accurate picture of what is actually happening at shelf level, not what was planned, but what exists today, in every shop, across every region.
The 4 Types of Retail Data Analytics
| Catégorie | Question clé | Exemple |
|---|---|---|
| Descriptive | What happened? | Out-of-stock rate last month |
| Diagnostic | Why did it happen? | Which location missed planogram compliance |
| Predictive | What will happen? | Stock-out risk forecast by SKU |
| Prescriptive | What should we do? | Recommended facing adjustments |
- Descriptive analytics is the starting point. It tells you what occurred across your store network, visit frequency, average share of shelf, compliance rates by region. It is the foundation every other type builds on.
- Diagnostic analytics goes one level deeper. When a KPI drops, diagnostic data analytics identifies which location, which SKUs, and which teams are responsible. It transforms a symptom into a root cause.
- Predictive analytics uses historical field data to anticipate future execution failures. If a promotional period is approaching and compliance in a region has been consistently low, the system flags the risk before the campaign launches.
- Prescriptive analytics is where retail data analytics becomes operational. It does not just report what is wrong, it tells field teams exactly what to fix, in which store, in what order, before they walk through the door.

How Retail Data Analytics Works: A Step-by-Step Process
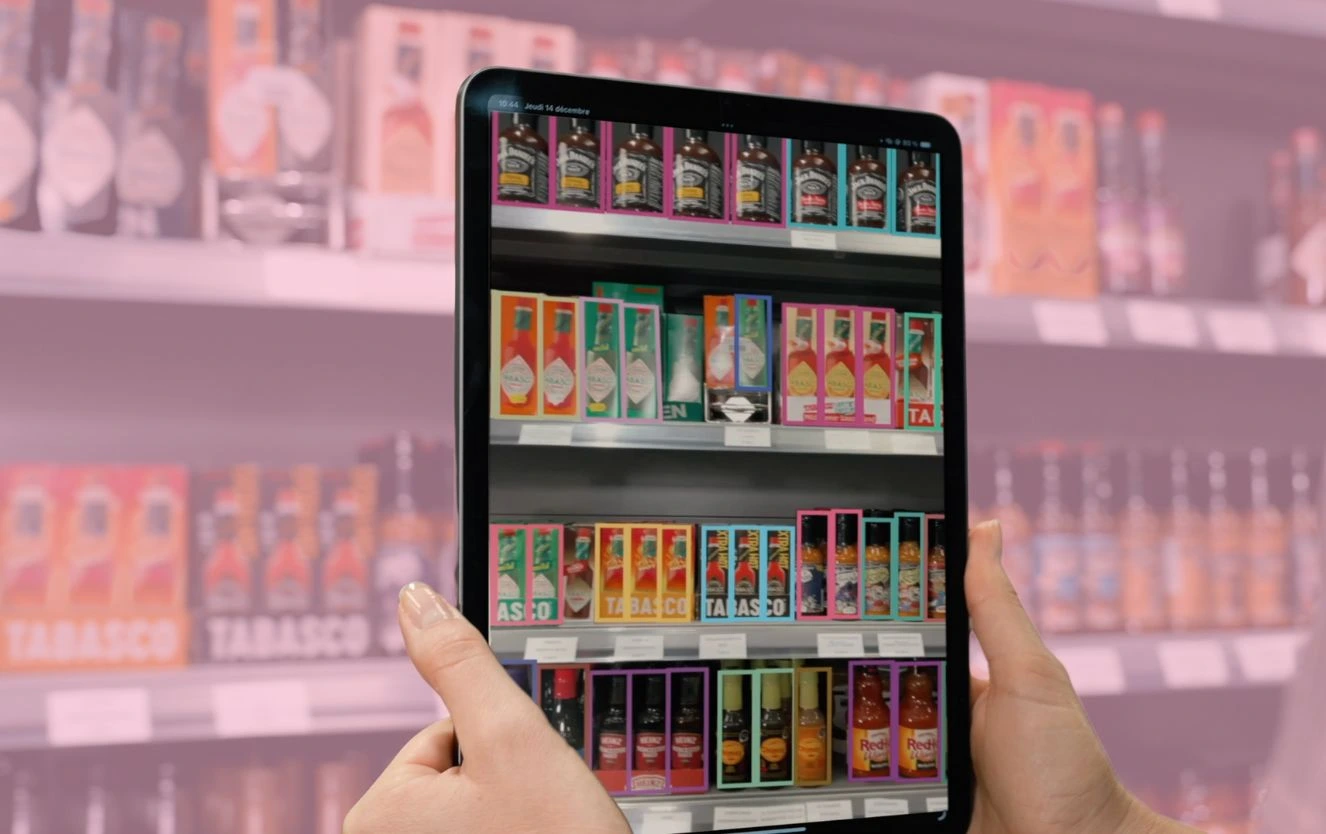
1. Data Collection: A field rep activates the video camera on a smartphone or tablet and walks through the store aisle. The device captures every product, every facing, every gap, entirely offline, with no internet connection required.
2. Data Processing: AI-powered image recognition analyzes the video in real time. It identifies each SKU, counts facings, detects out-of-stocks, and flags planogram deviations, automatically, without manual input.
3. KPI Generation: Within minutes of completing the aisle scan, the system produces a full set of retail KPIs: Share of Shelf, numeric distribution, OOS rate, planogram compliance score, and competitor positioning.
4. Data Integration: The data syncs automatically with the brand’s CRM, ERP, or internal sales dashboard. Field data flows directly into the systems where decisions are made, no exports, no spreadsheets.
5. Action and Decision: The field rep receives instant call-to-action recommendations on-device. Managers at headquarters get a live view of execution quality across every shop, every region, every team, updated after every visit.
Key KPIs Measured by Analytics
In-Store Execution KPIs
Share of Shelf (SoS) – the percentage of shelf space occupied by your brand versus competitors
Number of facings – how many product units are visible and fronted on shelf
Planogram compliance rate – the percentage of stores where shelf layout matches the brand’s guidelines
Out-of-stock (OOS) rate – the proportion of SKUs unavailable at the moment of the audit
Numeric Distribution (ND) – the proportion of shops where a given SKU is present
Performance and Strategy KPIs
Visit productivity – number of actionable KPIs generated per visit
Competitive share at shelf – your brand’s facing share relative to category competitors
Perfect Store score – composite compliance score across all execution criteria
Merchandising compliance by region – execution gap analysis across sales territories
Data freshness – audit frequency and recency across the store network
Retail Data Analytics vs. Traditional Store Audits
| Criteria | Traditional Store Audits | Retail Data Analytics |
|---|---|---|
| Speed | Hours per store | Minutes per aisle |
| Data volume | Sample-based | 100% of shelf captured |
| Accuracy | Subject to human error | 99%+ via computer vision |
| Offline capability | Paper-based only | Full AI processing, no internet needed |
| Actionability | Delayed reporting | Instant KPIs on-device |
| Data volume per visit | Limited | Up to 10x more field data |
Traditional store audits rely on sales reps manually counting facings, checking stock, and filling in forms. The process is slow, inconsistent, and impossible to scale. By the time the data is compiled and reported, execution gaps have already translated into lost sales and lost customers.
Retail analytics replaces this process entirely. The same shop visit that previously produced a partial, delayed snapshot now generates a complete, structured dataset, available to the field team instantly and to headquarters in real time.
Who Uses Retail Analytics?
CPG and FMCG Manufacturers Brands distributed across large retail networks use it to monitor whether their products are present, correctly positioned, in their inventory and compliant with merchandising guidelines at every point of sale. It is the only scalable way to bridge the gap between a national strategy and store-level reality.Field Sales Teams Sales representatives use retail analytics directly during store visits. Instead of spending time on manual counting and form-filling, they walk the aisle, generate KPIs and insights instantly, and use that data to negotiate shelf space with managers on the spot, backed by objective, real-time evidence.Category and Trade Marketing Managers Trade marketing teams use it to measure the effectiveness of promotions, track planogram adoption after resets, and identify which regions or retail banners are underperforming. It connects execution data directly to sales outcomes, making ROI measurement concrete and repeatable.
How EasyPicky Delivers Retail Data Analytics ?
EasyPicky is a retail data analytics solution built for CPG and FMCG brands that need accurate, real-time shelf intelligence at scale. A sales rep walks into a Walmart or a Kroger, activates the EasyPicky app on their smartphone, and films the aisle. In under two minutes, the app has captured every facing, every out-of-stock, every planogram deviation, processed entirely offline, with no internet connection required to use the tool. The rep receives immediate action recommendations directly on-device, telling them exactly what to fix, in which order, before moving to the next aisle. Those recommendations are powered by a computer vision engine that delivers 99% detection accuracy, giving field teams the confidence to negotiate shelf space with store managers on the spot, backed by objective, real-time data rather than estimates.
On the headquarters side, all of that field data flows automatically into centralized dashboards the moment connectivity is restored. Every store visit, every KPI, every execution gap becomes instantly visible to every team that needs it, sales managers tracking regional performance, category managers monitoring planogram compliance, marketing teams measuring promotional execution. This works regardless of how your field operation is structured. Whether you run your own dedicated sales force, work with external field agents, or rely on crowdsourcing to cover a large store network, EasyPicky consolidates every data point into a single, unified view of your retail execution, giving headquarters the visibility they need to make faster, smarter decisions at every level of the organization.
FAQ
What is retail analytics?
Retail data analytics is the process of collecting and analyzing in-store field data, shelf presence, stock levels, planogram compliance, to generate KPIs that help CPG brands and retailers make faster, more accurate merchandising and sales decisions.
What data is collected in retail data analytics?
It captures shelf presence, product facings, out-of-stock rates, competitor positioning, planogram compliance, share of shelf, and visit frequency, all collected automatically during field team store visits using AI-powered mobile scanning.
How is AI used in retail data analytics?
AI image recognition analyzes video footage captured in-store to automatically identify SKUs, count facings, detect gaps, and flag compliance issues, generating a full set of KPIs in real time, without manual data entry.
What is the difference between retail data analytics and digital shelf analytics?
Retail data analytics covers physical in-store execution, what is actually on the shelf in brick-and-mortar shops. Digital shelf analytics covers online product listings, availability, content, and pricing on e-commerce platforms.
How does retail analytics improve sales performance?
By identifying execution gaps, out-of-stocks, wrong facings, planogram drift, before they translate into lost sales. Field teams receive instant recommendations during the store visit, allowing them to correct issues on the spot rather than days later.

The Complete Guide to Retail Data Analytics: Definition, Types & How It Works

POSM: The Guide for Retail Brands in 2026 & How to Finally Track Them at Scale

Why Mondelez Benelux Transitioned to EasyPicky & How It Unlocked Faster, Smarter Store Execution


